
(Background Image Source: TI https://e2e.ti.com/blogs_/b/powerhouse/archive/2015/09/05/power-tips-setting-up-bode-plotter-properly)
Picture this, a frequent customer decides to buy one of your regulators to suit the power needs of his product. After mounting the regulator onto the application board, mayhem ensues as the load keeps turning on and off. Distraught by such idiosyncratic behavior, the customer files a complaint. "God damn it! Why are the regulators I purchased screwing with my product?!" He sends you his application board and instructions as to where to put the regulator. After performing a test, you find out the output of your regulator is oscillating when the load is turned on!
In the semiconductor industry, scenarios like the one above are avoided by testing voltage regulators for stability. There are many ways to do this, such as pulsing the output at 2 different current levels (transient analysis) or observing the gain and phase of the regulator's response to an AC signal at it's feedback path (AC analysis). If one were to opt for the latter method, a proper instrument should be chosen for the desired application.
Frequency Response Analyzer vs. Network Analyzer
There are popularly two instruments used for measuring parameters that could judge a feedback system's stability. They are the frequency response analyzer, which can be a standalone instrument like NF's FRA51615 (see below) or built-in to oscilloscopes like Agilent's Infinivision scopes, and the network analyzer (not the one for data networks!).
Both instruments inject signals to the D.U.T. (device under test) and measure response at the output (which is usually a low-impedance terminal - unless you're dealing with a constant current source). The difference lies on frequency range. Frequency response analyzers accommodate the lower end of the spectrum better but are limited at higher frequencies, typically up to a few MHz, whilst network analyzers can work with frequencies up to 1 THz! Because voltage regulators by and large do not deal with RF frequencies, frequency response analyzers become the preferred choice for one's verification needs.
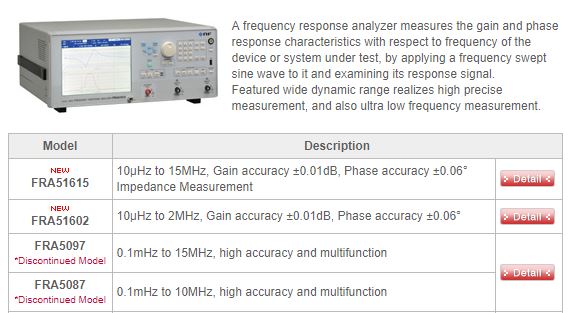
NF's new line of Frequency Response Analyzers support frequencies as low as 10 microHertz!!
(Source: NF Website - http://www.nfcorp.co.jp/english/pro/mi/fre/index.html)
Trivia: Did you know that the first network analyzer was developed by MIT in 1929? It was built for academic use but was also rented by commercial companies like the American Gas and Electric Company. It became obsolete after the birth of digital electronics (1950s) where it's components became too bulky compared to competitors.
Measurement and Setup
Now that we have chosen the frequency response analyzer, how do we set it up on our test bench? Before anything else, there are a roster of factors we must consider, such as noise sources from both the environment and other instruments being used, wiring connection optimization, and considerations for any exogenous element that may contribute to a misreading in the frequency response analyzer.
An elaboration of a detailed measurement setup and method will not be covered in this article. However, there is an excellent application note from ROHM's website that covers this topic (please see the link below)

The FRA has 3 ports, 2 input ports (CH1 and CH2) that measures the difference in amplitude and phase between the signals fed to each and an output port (OSC) which spews a sine wave of preset amplitude and frequency. A resistor is introduced at the feedback path of the regulator (commonly termed the "FB" terminal, initials assumed to stand for FeedBack) shunt to the OSC port of the FRA. This adds oscillation to the feedback signal fed to CH1 of the FRA, with the effect at the output fed to CH2. There will be a difference in gain (because the signal will be "regulated" as it goes through the converter) and phase (due to propagation delay), and these data will be displayed on the screen of the FRA.
Obviously, any noise source may contribute to inaccuracies in the measured gain and phase. Hence, measurement in an electrically quiet environment, using power supplies with the least amount of noise, is a must to ensure data integrity. A loop-gain adapter is also recommended to ease interfacing difficulties at the expense of accrued thermal noise (or Nyquist noise) from additional components.
Confirming 0 dB Crossover Frequency
There are also times when measured phase margin is too low to pass customer specifications, especially at high loads and large values of output capacitance (Remember the trade-off of ripple and stability?). It's during these times that one would take a closer look at measurement data. Perhaps the zero crossover frequency is incorrect?
One way of being sure is by measuring the gain manually. A pulse generator set to output a sine wave at crossover frequency can replace the OSC port, while 2 voltmeters set at AC can measure gain (using the formula 20*log(Vac1/Vac2) where Vac1 is the reading of 1 voltmeter while Vac2 is the reading of the other. If Vac1=Vac2 then the crossover frequency is confirmed. If they're not equal, then there is a problem either with the FRA (which may not be calibrated) or the test bench setup.
Measurement including phase (with a scope) is featured in one of TI's application report (link below):
Frequency response analyzers aren't limited to gain and phase measurements. There are a lot of other measurements that can be performed with this instrument, such as impedance measurements of capacitors, resonance characterization of piezoelectric elements, and so on. These topics however, are for another article.
0 Comments